
A picture paints a thousand words, so the saying goes. Thus, if you have lots of textual and numerical data and you want to present them in a clear, organized and concise method, the best way to do it is to use either charts, graphs, flowcharts, or diagrams. Unlike a narrative, charts, graphs and diagrams, translate facts and information into something that can be visually compared thus, automatically giving the viewer an idea as to which of the elements present has the highest or lowest data, or in the case of a flowchart which goes first, and which is last.
Making charts, graphs, diagrams and flowcharts however is not easy. This is true especially if you don’t have the right tools to use. Fortunately, there are web apps that you can use to make attractive data presentations in a hassle-free and convenient manner. This article is exactly what it is all about.
Here, we are attempting to cover every visual data presentation method that you might use depending on your needs. We therefore invite you to go over these items and see if any of these serves your purpose. If any of these does, please leave us a comment below. We will also appreciate any comment, suggestion and of course recommendation of this article to your social media friends. Enjoy!
SmartDraw
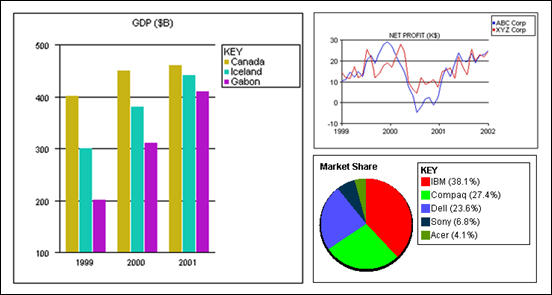
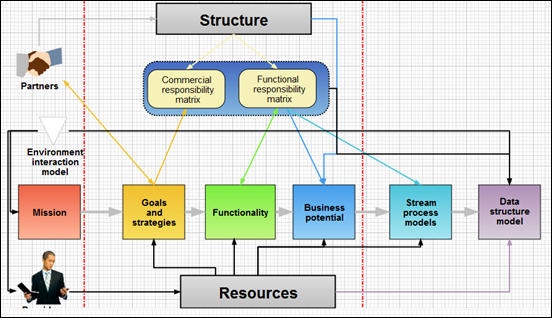
SmartDraw is a complete business graphics solution, so not only will you get great charts, but you’ll get presentation-quality business graphics of all kinds, like flowcharts, marketing diagrams, org charts, and much more.
JS Charts
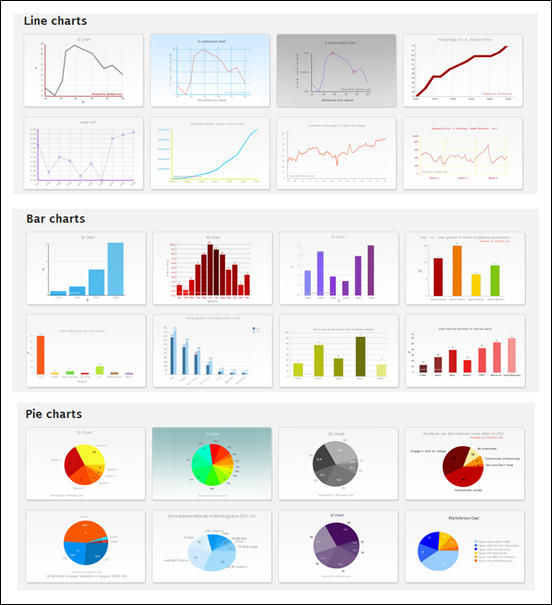
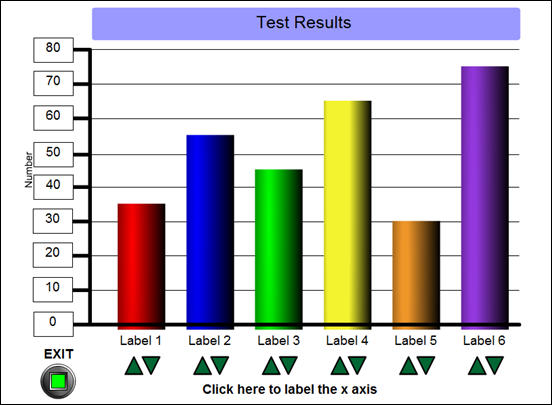
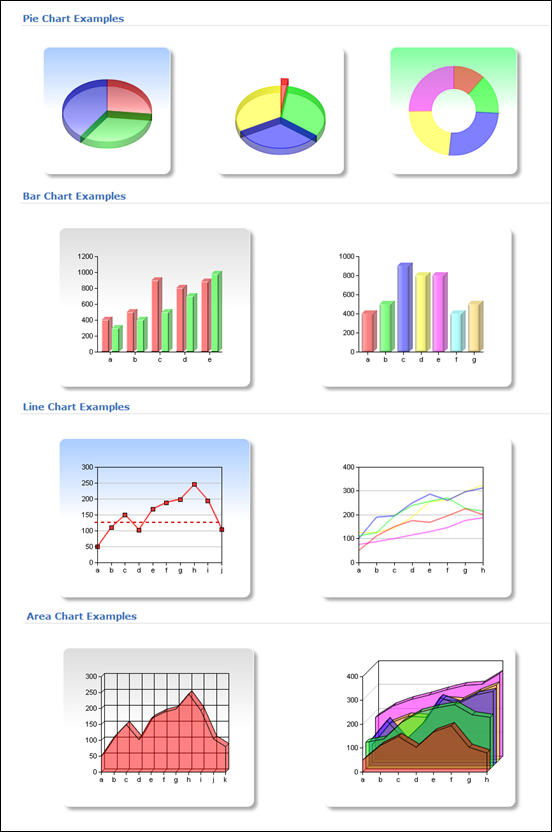
JS Charts is a JavaScript based chart generator that requires little or no coding. With JS Charts drawing charts is a simple and easy task, since you only have to use client-side scripting (i.e. performed by your web browser). No additional plugins or server modules are required. Just include our scripts, prepare your chart data in XML, JSON or JavaScript Array and your chart is ready! JS Charts lets you create charts in different templates like bar charts, pie charts or simple line graphs.
Barchart Generator
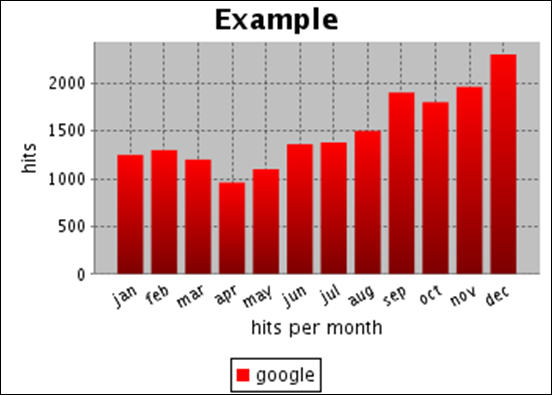
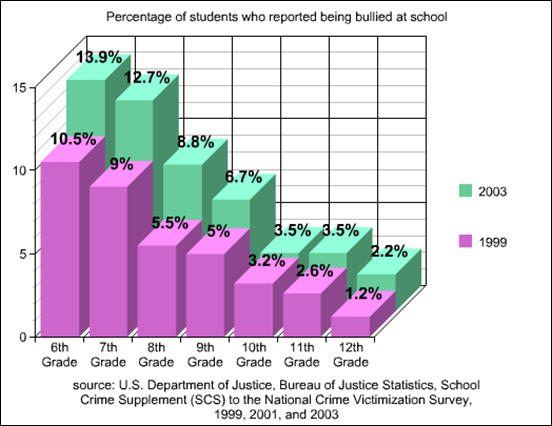
As the name suggests you can create barchart with this tool and save your date in the input chart.
Chart Demo
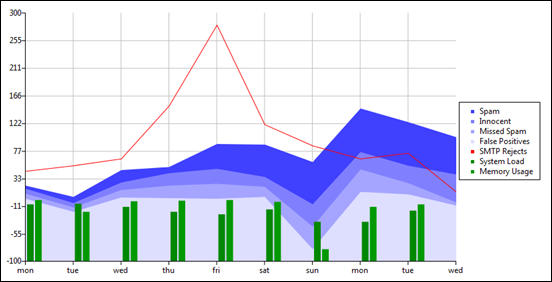
This tool can let you present your data in a visually appealing stacked area chart, line chart and bar chart.
XML/SWF Charts
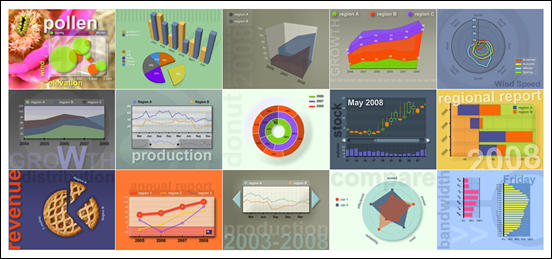
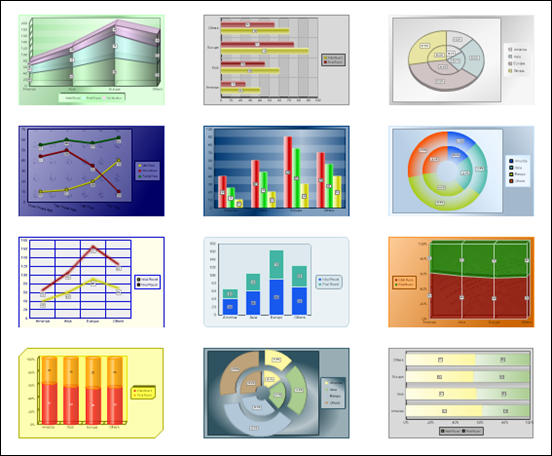
XML/SWF Charts is a simple, yet powerful tool to create attractive charts and graphs from XML data. Create an XML source to describe a chart, then pass it to this tool’s flash file to generate the chart. The XML source can be prepared manually, or generated dynamically using any scripting language (PHP, ASP, CFML, Perl, etc.). XML/SWF Charts makes the best of both the XML and SWF worlds. XML provides flexible data generation, and Flash provides the best graphic quality.
GraphCharts
With GraphCharts, you can make make beautiful graphs and charts to visually present your data on your website.
Grapher
Grapher is an online bar graph generator that produces an attractive and illustration for your data. It is very to use but has only few options.
Create a Graph
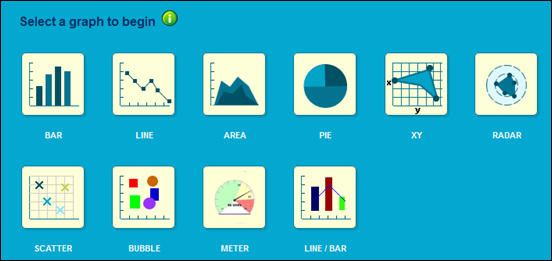
Create a graph lets you make colorful graphs and charts that you can download or print or send as a file. It can create line graph, bar graph, pie chart and so on.
Chart tool
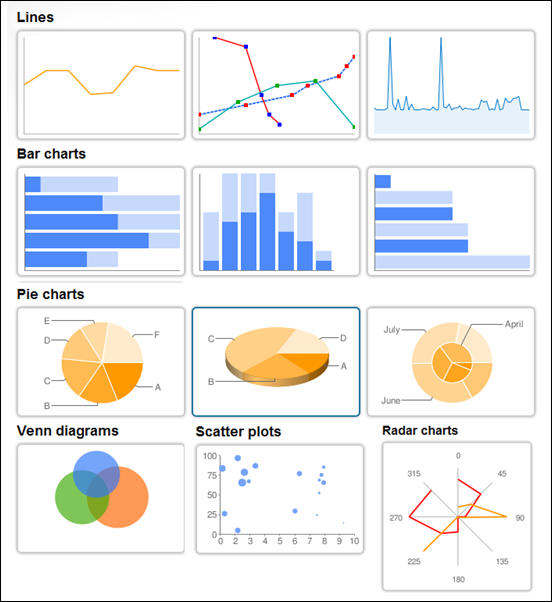
Chart tool can design and share your own graphs online and for free. It supports a number of different chart types like: bar charts, pie charts, line charts, bubble charts and radar plots.
DIY Chart
DIY (Do it yourself) Chart is a Web-based, simple and powerful online tool to create interactive charts and graphs from static or dynamic data which may be generated using any scripting language.
Hohli Online Charts Builder
Hohli allows you to create different kind of charts and graphs in full colors. It is equipped with color gradient where you can select the colors that like for your data.
Google Chart Tools
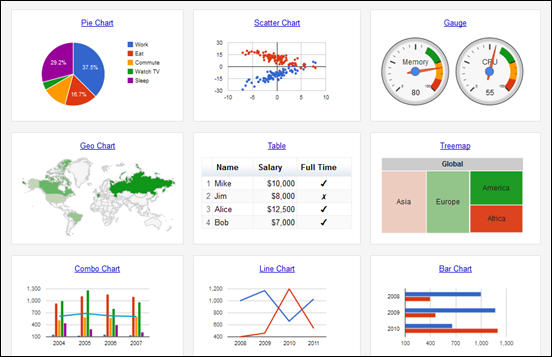
Google Chart Tools provide a perfect way to visualize data on your website. From simple line charts to complex hierarchical tree maps, the chart galley provides a large number of well-designed chart types. Populating your data is easy using the provided client- and server-side tools.
Rich Chart Live
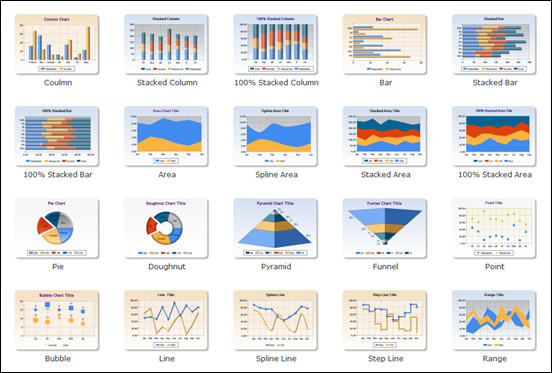
Rich Chart Live is a free online service which creates enjoyable and captivating charts with attractive visuals and interactivity. No software to download, nothing to install, all you need is any web browser that supports Flash, in Windows, Mac or Linux. Import your data from a spreadsheet, export your chart as a Flash animation, as a PowerPoint presentation or embed directly to your blog or website by just copy & pasting HTML.
amCharts
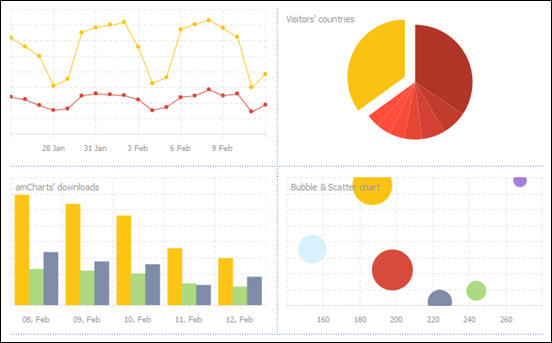
amCharts offers JavaScript/HTML5 charts for most of your needs. The set includes serial (column, bar, line, area, step line, smoothed line, candlestick and ohlc graphs), pie/donut, radar/polar and xy/scatter/bubble charts.
Chartle
Chartle tears down the complexity of online visualizations – offers simplicity, ubiquity and interactivity of your presentations.
Pie Color
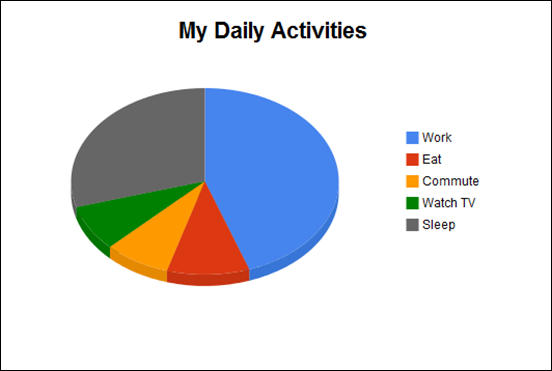
A simple tool that creates color pie chart. It will translate your data into an image that you can download for free.
Make a Line Graph
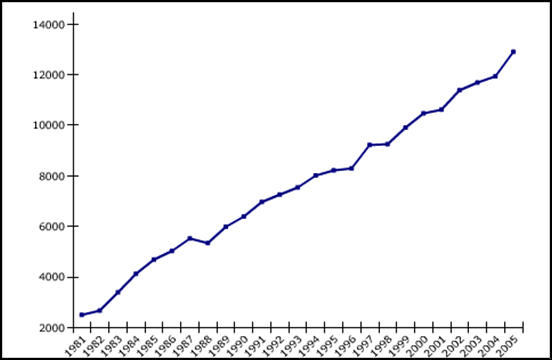
This online tool lets you create a clean simple line graph that you can use for free.
Ajax MGraph
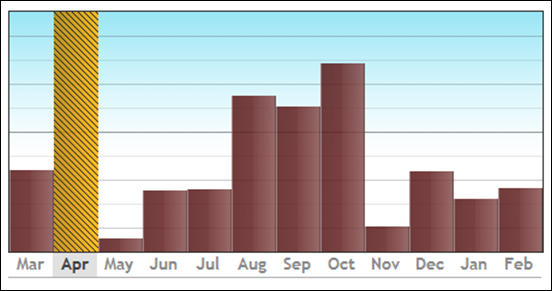
Ajax MGraph is an interactive graph that highlights the bar that you select on mouse over.
Clustered/Stacked Filled Bar Graph Generator
Bar graphs that are either clustered or filled and present a unique presentation of your data.
CoPlot
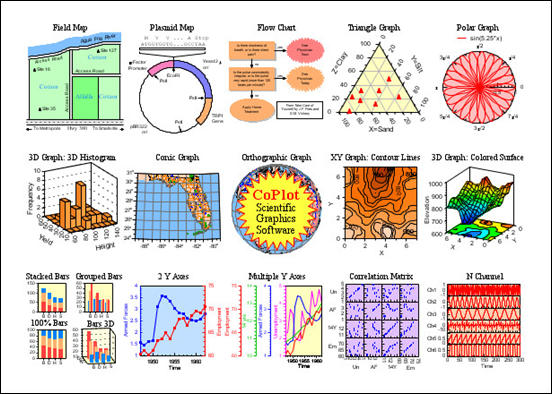
CoPlot is an incredibly versatile program for making publication-quality 2D and 3D scientific graphs (which plot data and equations), maps, and technical drawings. Every aspect of CoPlot has been designed around one basic goal: to make a program that is so versatile that scientists and engineers can easily get exactly what they want. CoPlot includes CoStat for data handling and statistics.
ChartGo
Create a graph online quickly. Create bar graphs, line graphs or pie charts. Simply choose your settings, paste your data in the Chart data area and hit the create button.
Lucid Chart
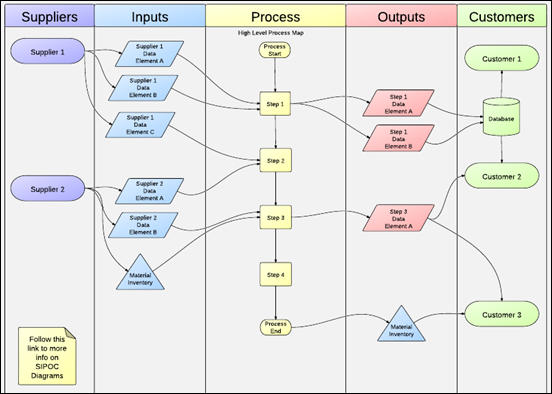
LucidChart provides the easiest and most powerful online flowchart software in the world. Create professional diagrams and flowcharts to help you communicate visually.
Flowchart.com
Flowchart.com is an online multi-user, real-time collaboration flow charts service. It’s Flowcharting made easy. You can collaborate with your colleagues in real-time. All collaborating parties can chat and design flow charts at the same time. Flowchart.com does not require any software download, it works with your favorite browser such as: Firefox, Microsoft Internet Explorer, Opera, Safari, Google Chrome. Flowchart.com works on any Operating System.
Gliffy
Gliffy lets you make colorful and attractive diagrams and flowcharts with the click of a button.
Stat Silk
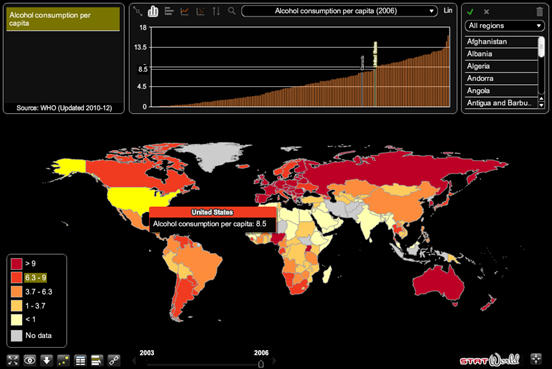
StatSilk offers a range of web-based and desktop software to cater to diverse mapping and visualization needs. It goal is to make data analysis easy, efficient and enjoyable.
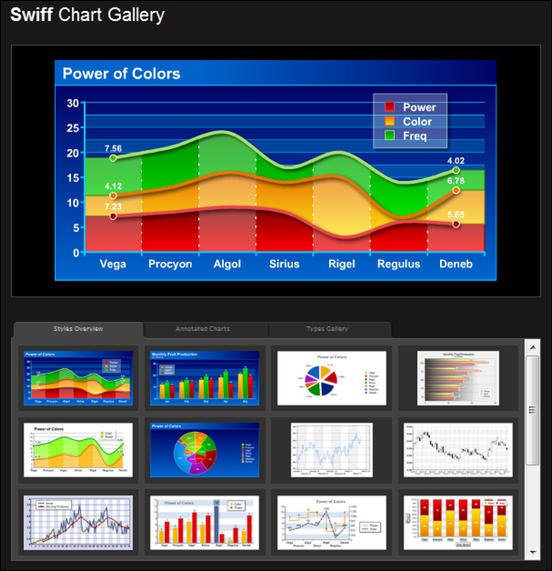
Swiff Chart 3
Swiff Chart lets you create Eye Catching Animated Charts in Adobe Flash format. Paste your data from a speadsheet or import a formatted text file, choose a predefined Chart Style, adjust parameters and instantly export your animated Chart as a Adobe Flash movie.
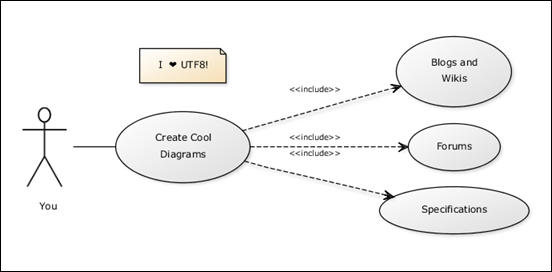
yUML
Create and share simple UML diagrams in your blogs, wikis, forums, bug-trackers and emails.
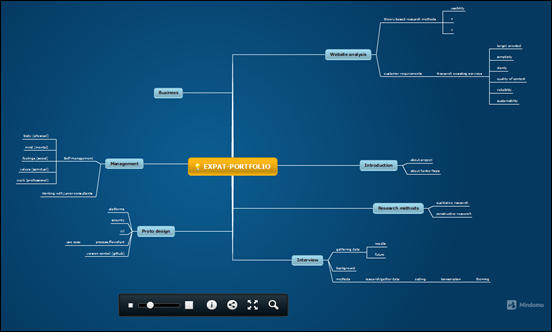
Mindomo
Mindomo is a mind mapping/diagramming app that you can use to organize your work, solve problems creatively, and find the next big idea and learn more in an orderly fashion.
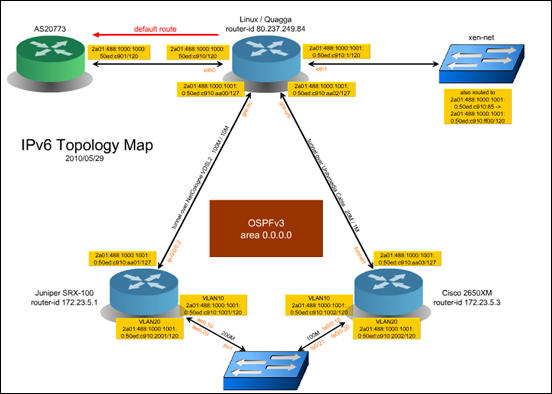
yEd Graph Editor
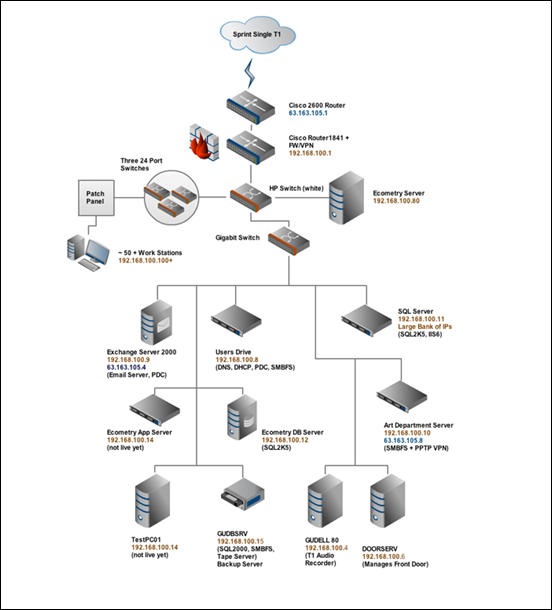
yEd is a powerful desktop application that can be used to quickly and effectively generate high-quality diagrams. Create diagrams manually, or import your external data for analysis. Our automatic layout algorithms arrange even large data sets with just the press of a button. yEd is freely available and runs on all major platforms: Windows, Unix/Linux, and Mac OS. The latest release is version 3.9
Draw Anywhere
Draw, modify and share flowcharts and other diagrams easily. This online solution has the power and look & feel of a desktop application. It runs entirely on the web, and thus it is an always-on-access-anywhere solution. It meets all your diagramming needs without having to install, maintain and purchase expensive software.







One Response to “30 Web Apps in Making Charts, Graphs, Flowcharts, and Diagrams”
August 2, 2012
john sI recommend a program called Graphs Made Easy. It’s free, easy to use, provides simplified data entry, or faculty to import data from data-grid programs including MS Excel.
It’s graphs are easy to manipulate, results look great, and it also includes some features that could be unique, like multi-coloured line graph lines.
Of course, I would say it’ a great program – I work for them!